Extra Diagram
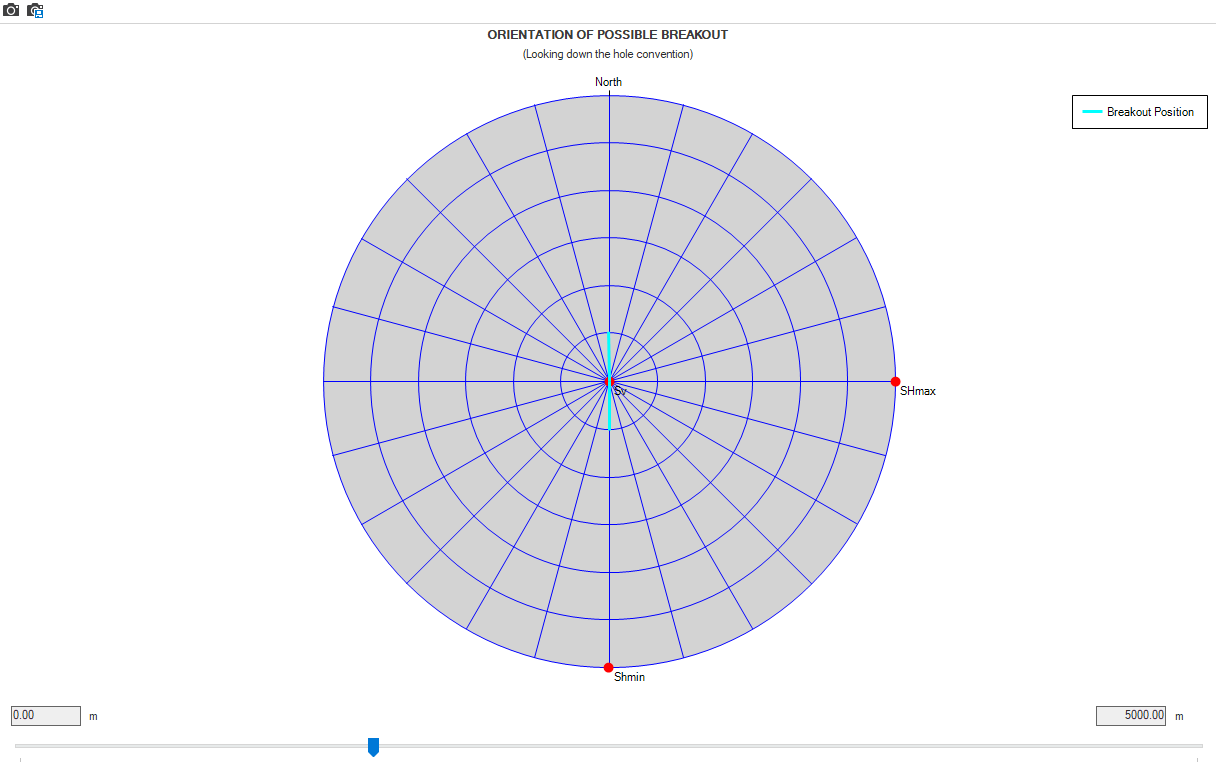
With the Extra Diagram button you open the Extra Diagram View. The view consists of an auxiliary plot that illustrates the orientation of possible fractures with the ‘looking down the hole’ convention. The principle stresses are also shown in the view along with a summary table that displays the reference parameters on the right-hand side of the chart.
Extra diagram is different when At The Wall is run using an isotropic failure model compared to using anisotropic failure mode. In the Extra diagrams, there is no variation in color around the hole. The analysis computes whether failure has occurred or not along with the orientation of the breakout.
Example of a stability plot shown at fixed depth with the effect of mud weight on different borehole stresses . click to enlarge